

What?
Shrink your Data Reporting
![]()
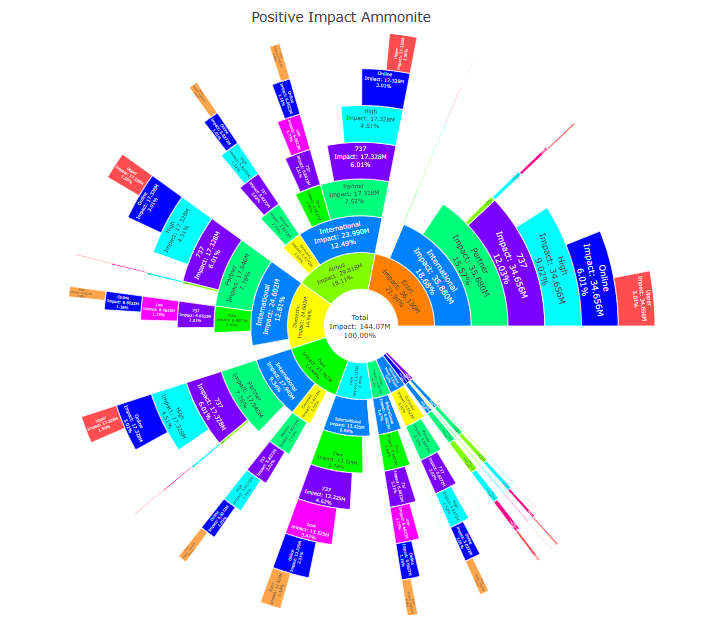
Cut Thru the forest of board reports.
Focus on only high impacting trends
![]()
Shows you insights you would otherwise miss
The MISSING 80%

How Does It Work
Calculates the impact of KPI trends over time

. Herding the Cats
Transforms all your KPI's into a common unit of measure.
You can directly compare all of your KPI's

Explains 100% of the change in any process or measure
Shown in order of Impact

A new perspective of machine decisioning insight
Increases the precision, speed and agility of your decision-management processes

New Visuals and Drill Downs
Adds Cut thru to your existing analytics capability

KPI Reporting
Testing shows that we can change your reporting practices by up to 84%

Different Month, Same Sh*t ??
Wonder how ‘Data X-Ray’ works
no more trial and error click thru drill downs

CFOs
really know your numbers with FlashBI

FLASHBI
IMPACT analytics
“Revolutionary AI Analytics tool to get your Invisible Advantage….. Directly compare all of your data trends even if they have different units of measure.
Our Data X-ray analyses your Corporate Performance Measures to show which are having the biggest impact both positive of negative….”
When used in a process context, it shows the impact of each process step on the final process outcome.
You can see what really drives each of your processes
You don’t need perfect data – use what you have;
Data haystacks now cover the open plains of the new data frontier,
things turned sour….. so now
It is even harder to find your undefined needle in the ever-expanding haystacks
So What’s Different ?
Evaluates the wider impact of every measure

Ground-breaking Insights
Top 5 impacting KPI trends

Use KPI Impact to avoid missing critical underlying trends

New visualisations using
KPII

Avoid offsetting errors using
KPII

add Impact insights to your current analytics app

Are you ready for the next level ? …FlashBI.com.au
…Analytics with Artificial Intelligence.
- NEW Identify new Impact areas…..report better, faster, cheaper
- NEW Look ‘through the data’ using ‘Data X-Ray’ – no more click thru drill downs
- NEW AI generated reporting.
- NEW multi layer visualisations to reduce report sizes
The cost of being a Leader thru Analytics with AI is just $x per month. Are you ready ?
